Plot
There are multiple stages involved before one can start to plot the obtained data.
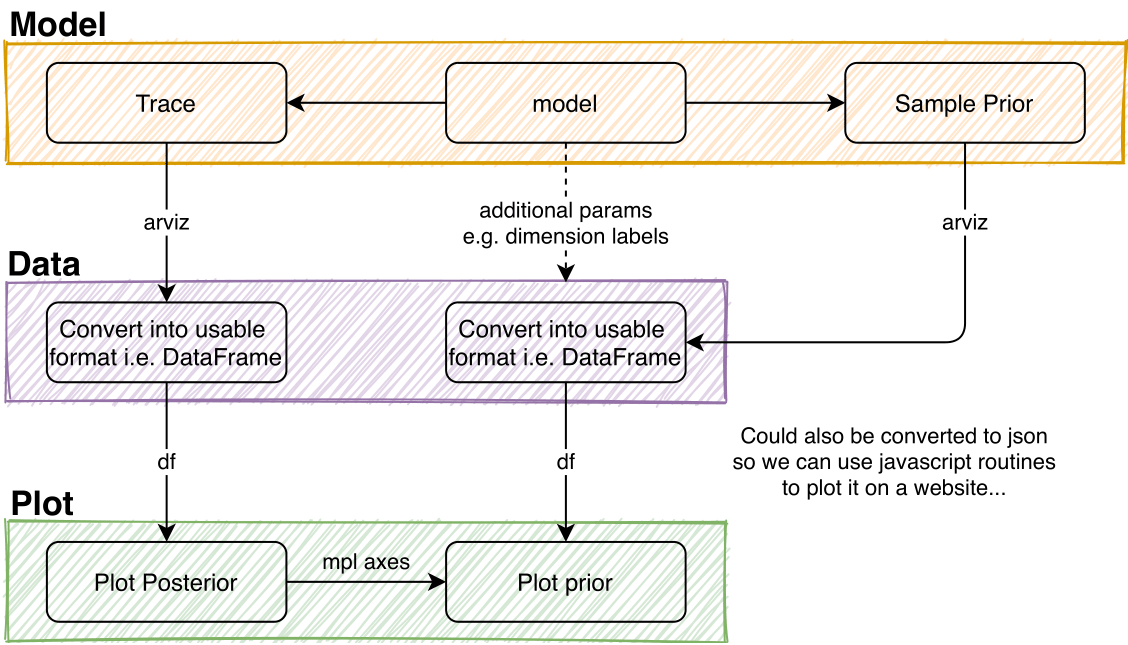
For model description, see Model.
Trace data can be converted with
covid19_npis.data.convert_trace_to_pandas_list().Plotting WIP
Data converter
-
covid19_npis.data.convert_trace_to_dataframe_list(trace, sample_state)[source]¶ Converts the pymc4 arviz trace to multiple pandas dataframes. Also sets the right labels for the dimensions i.e splits data by country and age group.
Do not look too much into this function if you want to keep your sanity!
- Parameters
trace (arivz InferenceData) –
sample_state (pymc4 sample state) –
- Returns
Multiindex dataframe containing all samples by chain and other dimensions defined in config.py
- Return type
list of pd.DataFrame
-
covid19_npis.data.convert_trace_to_dataframe(trace, sample_state, key, data_type=None)[source]¶ Converts the pymc4 arviz trace for a single key to a pandas dataframes. Also sets the right labels for the dimensions i.e splits data by country and age group.
Do not look too much into this function if you want to keep your sanity!
- Parameters
trace (arivz InferenceData) –
sample_state (pymc4 sample state) –
key (str) – Name of variable in modelParams
data_type (str) – Type of trace, gets detected automatically normally. Possible values are: “posterior”, “prior_predictive”, “posterior_predictive”. Overwrites automatic behaviour! default: None
- Returns
Multiindex dataframe containing all samples by chain and other dimensions defined in modelParams.py
- Return type
pd.DataFrame
Distribution
-
covid19_npis.plot.distributions.distribution(trace, sample_state, key, dir_save=None, plot_age_groups_together=True, force_matrix=False)[source]¶ High level plotting function for distributions, plots prior and posterior if they are given in the trace.
- Parameters
trace (arivz.InferenceData) – Raw data from pymc4 sampling, can contain both posterior data and prior data. Or only one of both!
sample_state (pymc4 sample state) – Used mainly for shape labels
key (str) – Name of the variable to plot
dir_save (str, optional) – where to save the the figures (expecting a folder). Does not save if None
Default: Noneforce_matrix (bool, optional) – Forces matrix plotting behaviour for last two dimensions
Default: False
- Returns
one figure for each country
- Return type
array of mpl figures
-
covid19_npis.plot.distributions.distribution_matrix(trace, sample_state, key, dir_save=None)[source]¶ High level function to create a distribution plot for matrix like variables e.g. ‘C’. Uses last two dimensions for matrix like plot.
- Parameters
trace (arivz.InferenceData) – Raw data from pymc4 sampling, can contain both posterior data and prior data. Or only one of both!
sample_state (pymc4 sample state) – Used mainly for shape labels
key (str) – Name of the variable to plot
dir_save (str, optional) – where to save the the figures (expecting a folder). Does not save if None
Default: None
- Returns
- Return type
axes
-
covid19_npis.plot.distributions._distribution(array_posterior, array_prior, dist_name, dist_math, suffix='', ax=None)[source]¶ Low level function to plots posterior and prior from arrays.
- Parameters
array_prior (array_posterior,) – Sampling data as array, should be filtered beforehand. If none it does not get plotted!
dist_name (str) – name of distribution for plotting
dist_math (str) – math of distribution for plotting
suffix (str,optional) – Suffix for the plot title e.g. “age_group_1”
Default: “”ax (mpl axes element, optional) – Plot into an existing axes element
Default:None
-
covid19_npis.plot.distributions._plot_prior(x, ax=None, **kwargs)[source]¶ Low level plotting function, plots the prior as line for sampling data by using kernel density estimation. For more references see scipy documentation.
It is highly recommended to pass an axis otherwise the xlim may be a bit wonky.
- Parameters
x – Input values, from sampling
ax (mpl axes element, optional) – Plot into an existing axes element
Default:Nonekwargs (dict, optional) – Directly passed to plotting mpl.
-
covid19_npis.plot.distributions._plot_posterior(x, bins=50, ax=None, **kwargs)[source]¶ Low level plotting function to plot an sampling data as histogram.
Time series
-
covid19_npis.plot.time_series.timeseries(trace, sample_state, key, sampling_type='posterior', plot_chain_separated=False, plot_age_groups_together=True, dir_save=None, observed=None)[source]¶ High level plotting fucntion to create time series for a a give variable, i.e. plot for every additional dimension. Can only be done for variables with a time or date in shape_labels!
Does NOT plot observed cases, these have to be added manually for now.
- Parameters
trace_prior (trace_posterior,) – Raw data from pymc4 sampling
sample_state (pymc4 sample state) –
key (str) – Name of the timeseries variable to plot. Same name as in the model definitions.
sampling_type (str, optional) – Name of the type (group) in the arviz inference data.
Default: posteriordir_save (str, optional) – where to save the the figures (expecting a folder). Does not save if None
Default: Noneobserved (pd.DataFrame, optional) – modelParams dataframe for the corresponding observed values for the variable e.g. modelParams.pos_tests_dataframe
-
covid19_npis.plot.time_series._timeseries(x, y, ax=None, what='data', draw_ci_95=None, draw_ci_75=None, draw_ci_50=None, **kwargs)[source]¶ low-level function to plot anything that has a date on the x-axis.
- Parameters
x (array of datetime.datetime) – times for the x axis
y (array, 1d or 2d) – data to plot. if 2d, we plot the CI as fill_between (if CI enabled in rc params) if 2d, then first dim is realization and second dim is time matching x if 1d then first tim is time matching x
ax (mpl axes element, optional) – plot into an existing axes element. default: None
what (str, optional) – what type of data is provided in x. sets the style used for plotting: * data for data points * fcast for model forecast (prediction) * model for model reproduction of data (past)
kwargs (dict, optional) – directly passed to plotting mpl.
- Returns
- Return type
ax